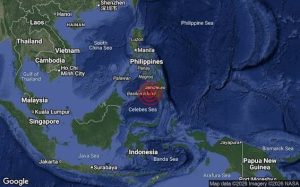
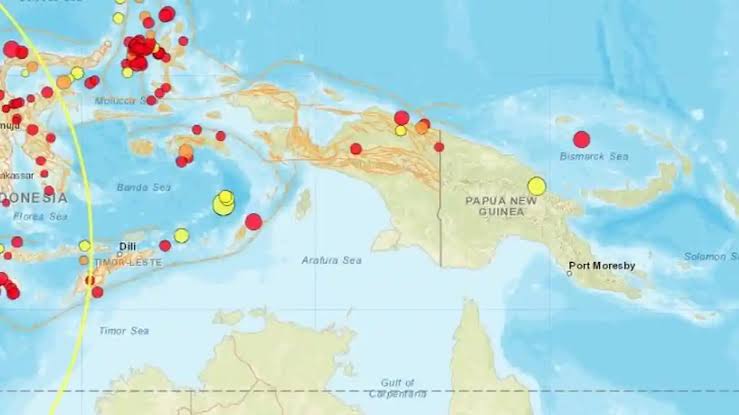
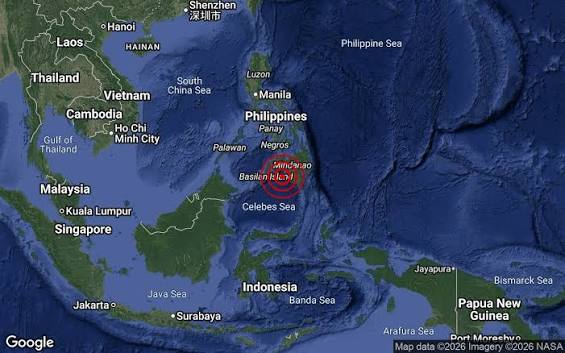
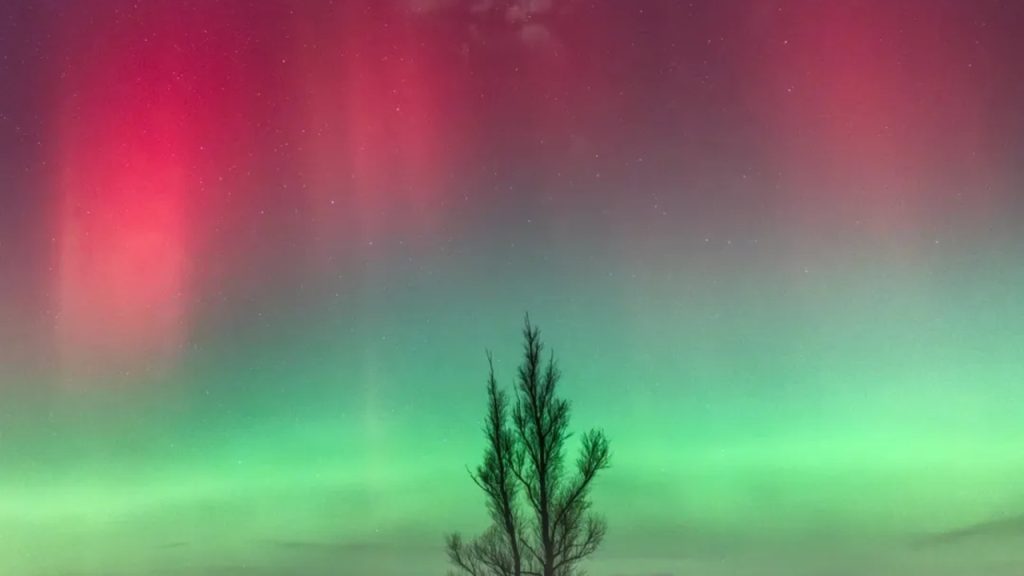
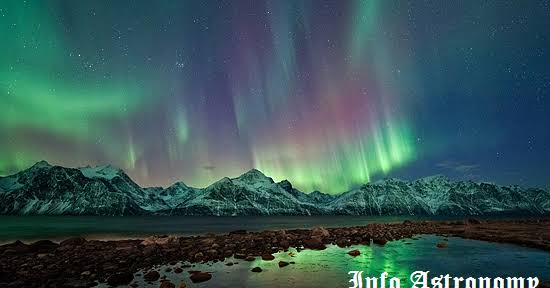
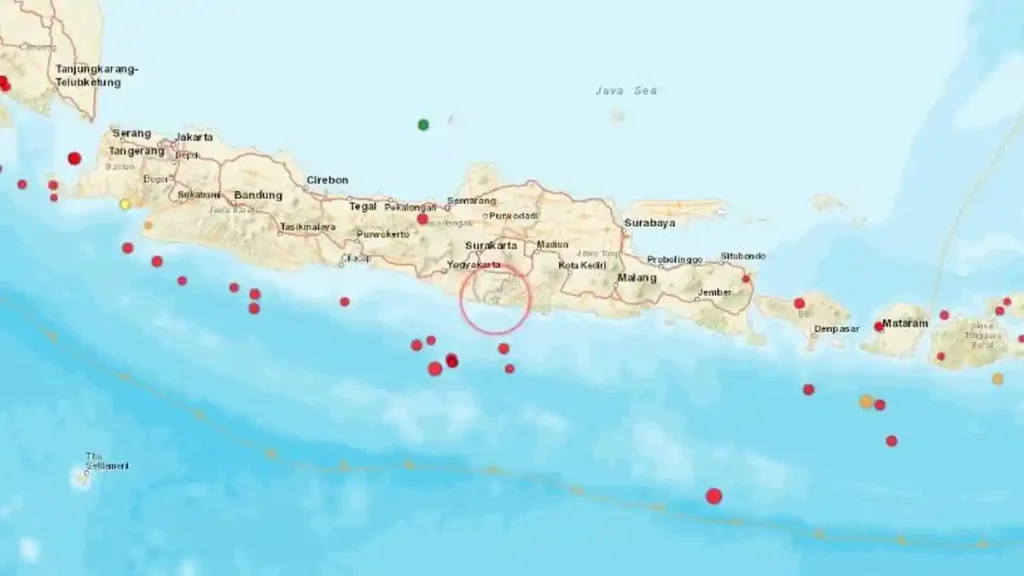
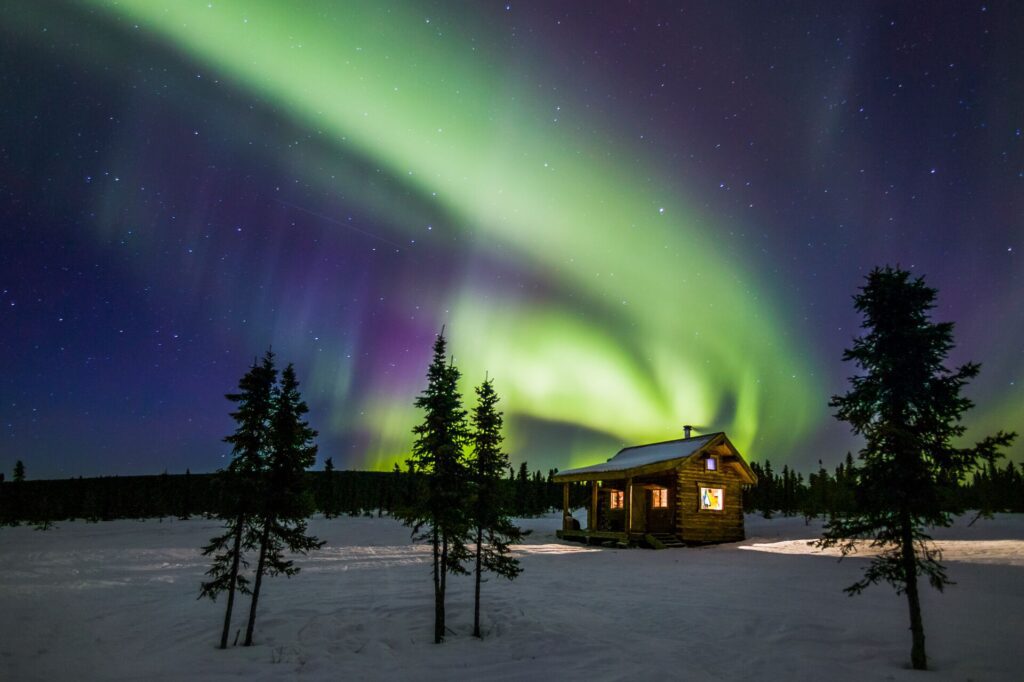
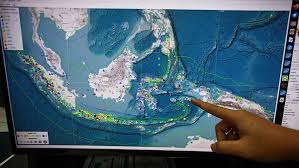
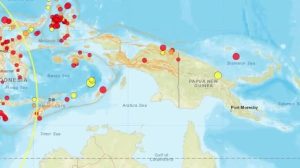
Time | Location | Magnitude | Latitude | Longitude | Depth (km) | More Info |
---|
This chart displays earthquake activity by country, updated every minute for the last 24 hours.
An earthquake is the shaking of the Earth's surface caused by a sudden release of energy in the lithosphere. Check Earthquake Simulation
Earthquakes occur when tectonic plates move and release energy along fault lines.
Seismic waves are energy waves that travel through the Earth during an earthquake.
The earthquake map provides real-time data on global seismic activity, allowing users to monitor recent earthquakes interactively.
The data is updated in real-time using reliable APIs and datasets, ensuring users see the latest seismic activity.
Yes, the earthquake map and all associated tools are free to use for all visitors.
Yes, the map includes sharing options, allowing you to share links to specific views or data points.
Yes, the map allows you to zoom in and pan across regions for a closer look at seismic events.
The 3D earthquake map provides an immersive view of seismic activity around the globe, using advanced 3D visualization.
Yes, the 3D map is optimized for both desktop and mobile devices, offering a seamless user experience.
The color coding represents the magnitude of earthquakes, with specific colors indicating severity levels.
Yes, the map includes historical data (last 24 hours), allowing users to view past seismic events within a chosen magnitude.
The data is sourced from reliable APIs and is highly accurate, though minor delays in reporting may occur.
The chart displays earthquake data by magnitude, location, or other metrics, depending on the selected parameters.
The chart data is updated in real-time, reflecting the latest available information.
Yes, the chart allows for customization, such as filtering data by magnitude or country. It does not filtered for USA, cause the data location is by State.
The 3D map is compatible with modern browsers such as Chrome, Firefox, Edge, and Safari.
You can report any issues using the contact form on our website or by sending an email to our support team.
First of all, the depth of an earthquake is usually the most difficult part of its location to determine with great accuracy. Since most earthquakes occur deep within the Earth's crust, an error of +/- 1 or 2 km is usually insignificant. However, if the earthquake depth is shallow, such errors become more noticeable.
Here are the main reasons for depths of 0 km or negative values:
It's also important to note that the depth parameter in earthquake data is the least constrained and often has larger error bars compared to the location of the epicenter. Variations in the calculation methods used by different seismic networks also contribute to the discrepancies in reported depth.
The geoid is an equipotential surface of the Earth's gravitational field, representing mean sea level as it would be in the absence of land and currents. It is used as a reference for many geophysical measurements, including earthquake depth calculations.
Seismic networks often use the geoid (such as the WGS84 geoid) as a baseline to measure depth. However, some networks may use alternative baselines, like mean sea level or the average elevation of the seismic stations. Differences in these reference systems can result in slight discrepancies in reported depths.
For shallow earthquakes or events near mountainous regions, these variations can make the reported depth appear as 0 km or even negative. This is why standardization and understanding the reference system are crucial when analyzing earthquake data.